
By integrating Zabbix with a messaging system such as Kafka, you unlock the ability to subscribe to and interpret messages, enabling the capture of performance statistics and information provided through these messages. This synergy enhances near real-time monitoring and issue detection, allowing for immediate action and ensuring system reliability and efficiency.
Kafka consists of Producers and Consumers. In this case the Producer is the monitored system (or system that collected information on behalf of that system) and the Consumer is Zabbix.
Example Use Case
As an example use case I will describe monitoring of an IoT device that produces Kafka messages. In this example the IoT device is a building ventilation system, both because it is relevant for me…but also because it is not related to any customer data / system so I can share it freely.
Components
- Kafka service
- Kafka topic
- ZABBIX Instance
- Device that produces metrics as Kafka messages
- ZABBIX Template that consumes Kafka messages. The template consists of:
- User Parameter
- Master Item
- Dependent Items
- Triggers
- Grafana Dashboard that visualises status and metrics
For this use case I assume that Kafka and ZABBIX are already setup and the producing IoT device is already producing messages into a Kafka topic.
Zabbix Template
The Zabbix Template consists of a master item that polls the Kafka Topic that contains the IoT messages. A master item is like a regular ZABBIX Item, it is only referenced as a master item on other items. This way every time the master item runs, every other dependent item runs at the same time.
Let me explain this further.
In the following screenshot you see getKafka. This is the item that polls for Kafka messages in the configured topic. You also see getKafka: ITHO * items. These items will be executed every time getKafka runs.
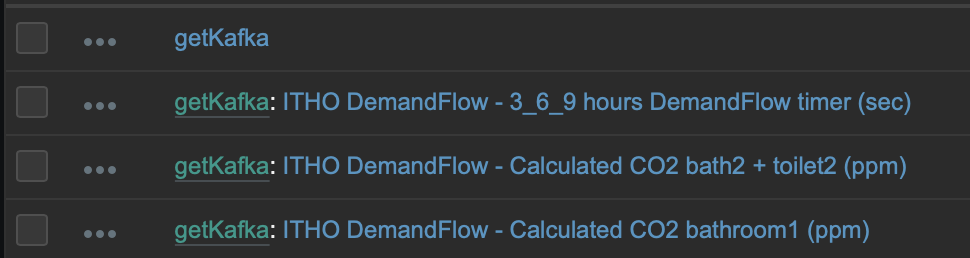
In this case getKafka rus every minute -> gets the latest message -> the message gets dissected by dependant items that extract their relevant piece of information from the message -> the result is stored in the Zabbix database.
User Parameter
A User Parameter in Zabbix is a custom item that allows you to define specific data collection commands on the monitored host, enabling the collection of unique or custom metrics not natively supported by Zabbix agents.
For this use case a User Parameter with the name getKafka is defined in the agent configuration of the machine that will consume the Kafka messages. This configuration is stored in the file: /etc/zabbix/zabbix_agentd.d/ITHO.conf
UserParameter=getKafka,kcat -C -b localhost:9092 -t itho-metrics -p 0 -o -1 -e -q
What this does is executing kcat with essential parameters. Kafka kcat (formerly known as kafkacat) is a versatile, command-line utility that acts as a producer, consumer, and metadata browser for Apache Kafka. It is used for producing and consuming messages from Kafka topics, as well as for inspecting cluster and topic metadata, making it a valuable tool for developers and administrators working with Kafka clusters.
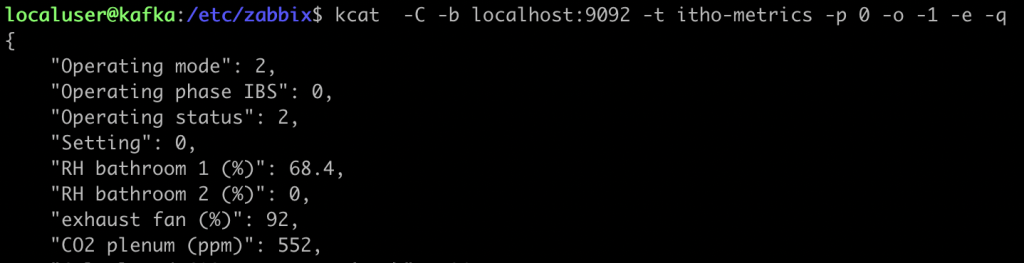
The command kcat connects to the Kafka instance (in this case localhost:9092) to get the latest message from the topic itho-metrics. The message is returned to Zabbix in json format for further processing.
Example of the output:
Master Item
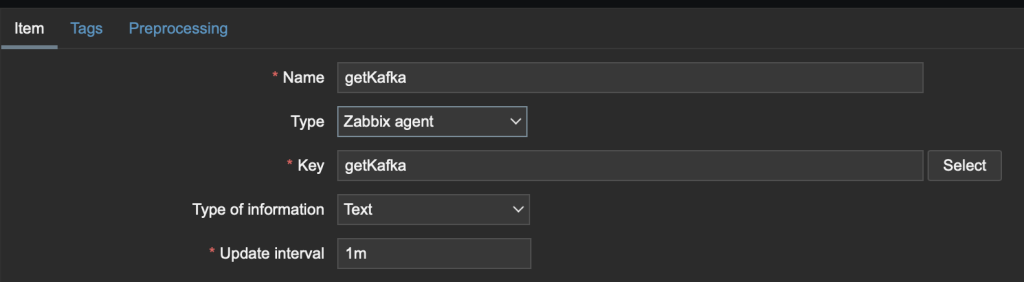
The Master Item leverages the above mentioned User Parameter. In this case it is called getKafka with a key value getKafka. The key value is the information that is requested from the Zabbix Agent, and must be named like the User Parameter in the step above. The agent then executes the user parameter (kcat in this case) to get the latest message from the Kafka topic.
Dependent Items
The Dependent Item, configured with a specific Type, uses the “getKafka” item as its Master Item. Through preprocessing, it extracts the relevant value from the results obtained by the Master Item. This is also where you configure data retention in the ZABBIX database, in this case 365 days for history and 10 years for trends.
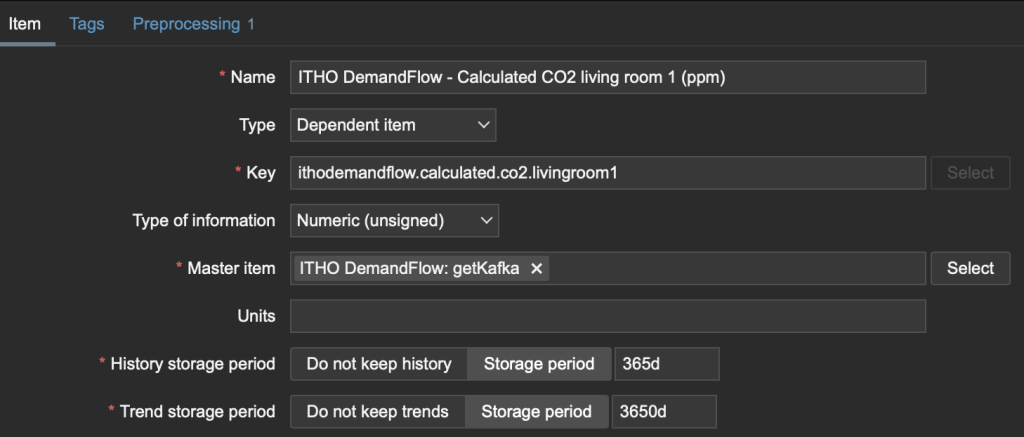
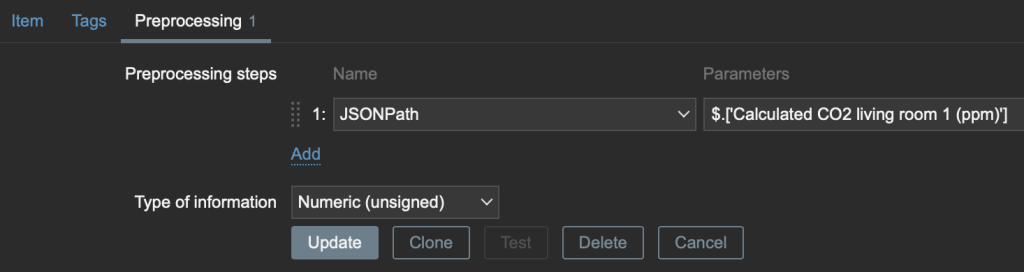
The preprocessing defines the value that will be extracted by specifying the JSON path. This parses the JSON message and gets the relevant value by leveraging RegEx. The type of information is set to Numeric in this case.
There must be a Dependent Item for all metrics that you want to extract from de Kafka message.
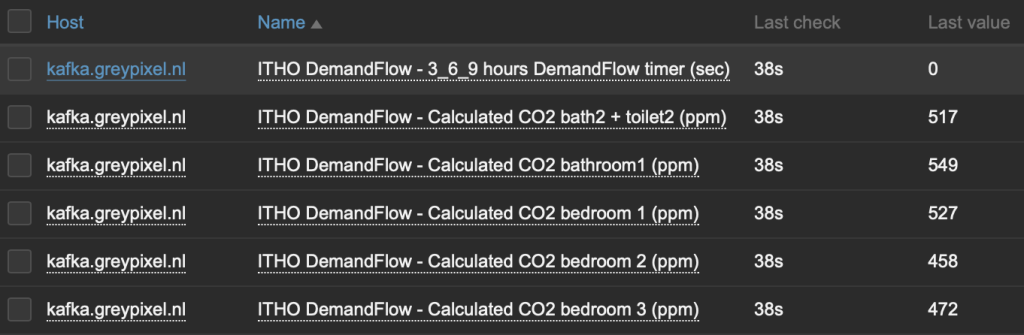
Checking the results
The polled and parsed information is now visible in the “Latest data” view in the Zabbix console:
Triggers
The metrics for the device are now available as values on (dependent) items, the next step is to create triggers for subjects for which that is desired. A trigger can create a Problem / Alert when a threshold is breached, it is also possible to send out a notification via i.e. email or slack when a problem is raised.
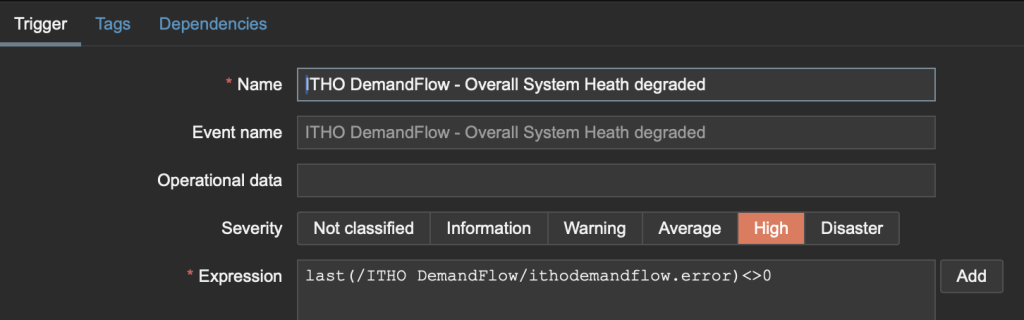
In this case a trigger for the overall System State is configured, a value of “0” is OK. All else is critical.
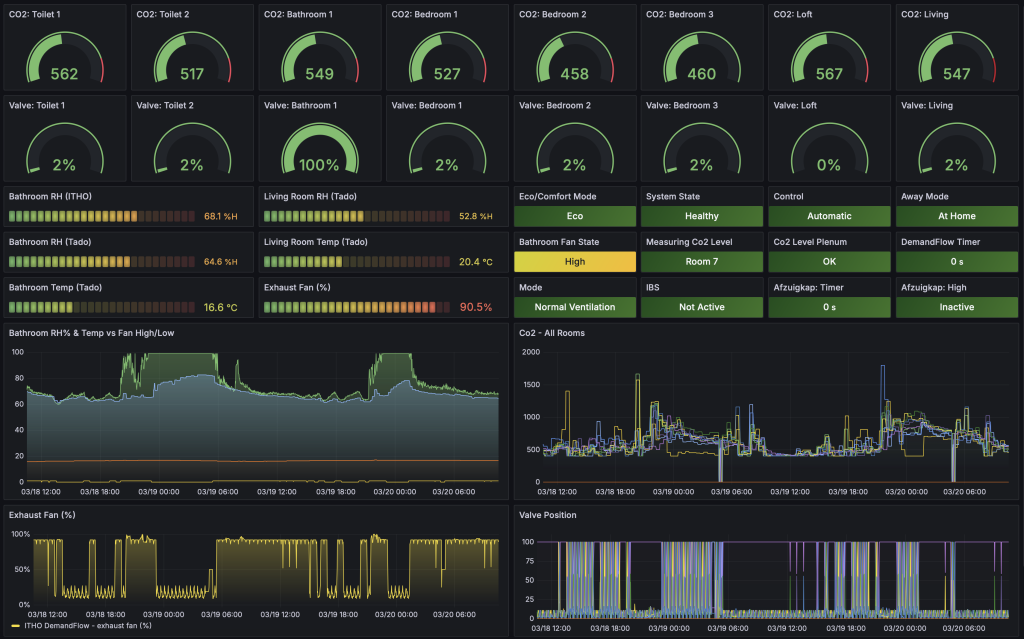
Grafana Dashboard
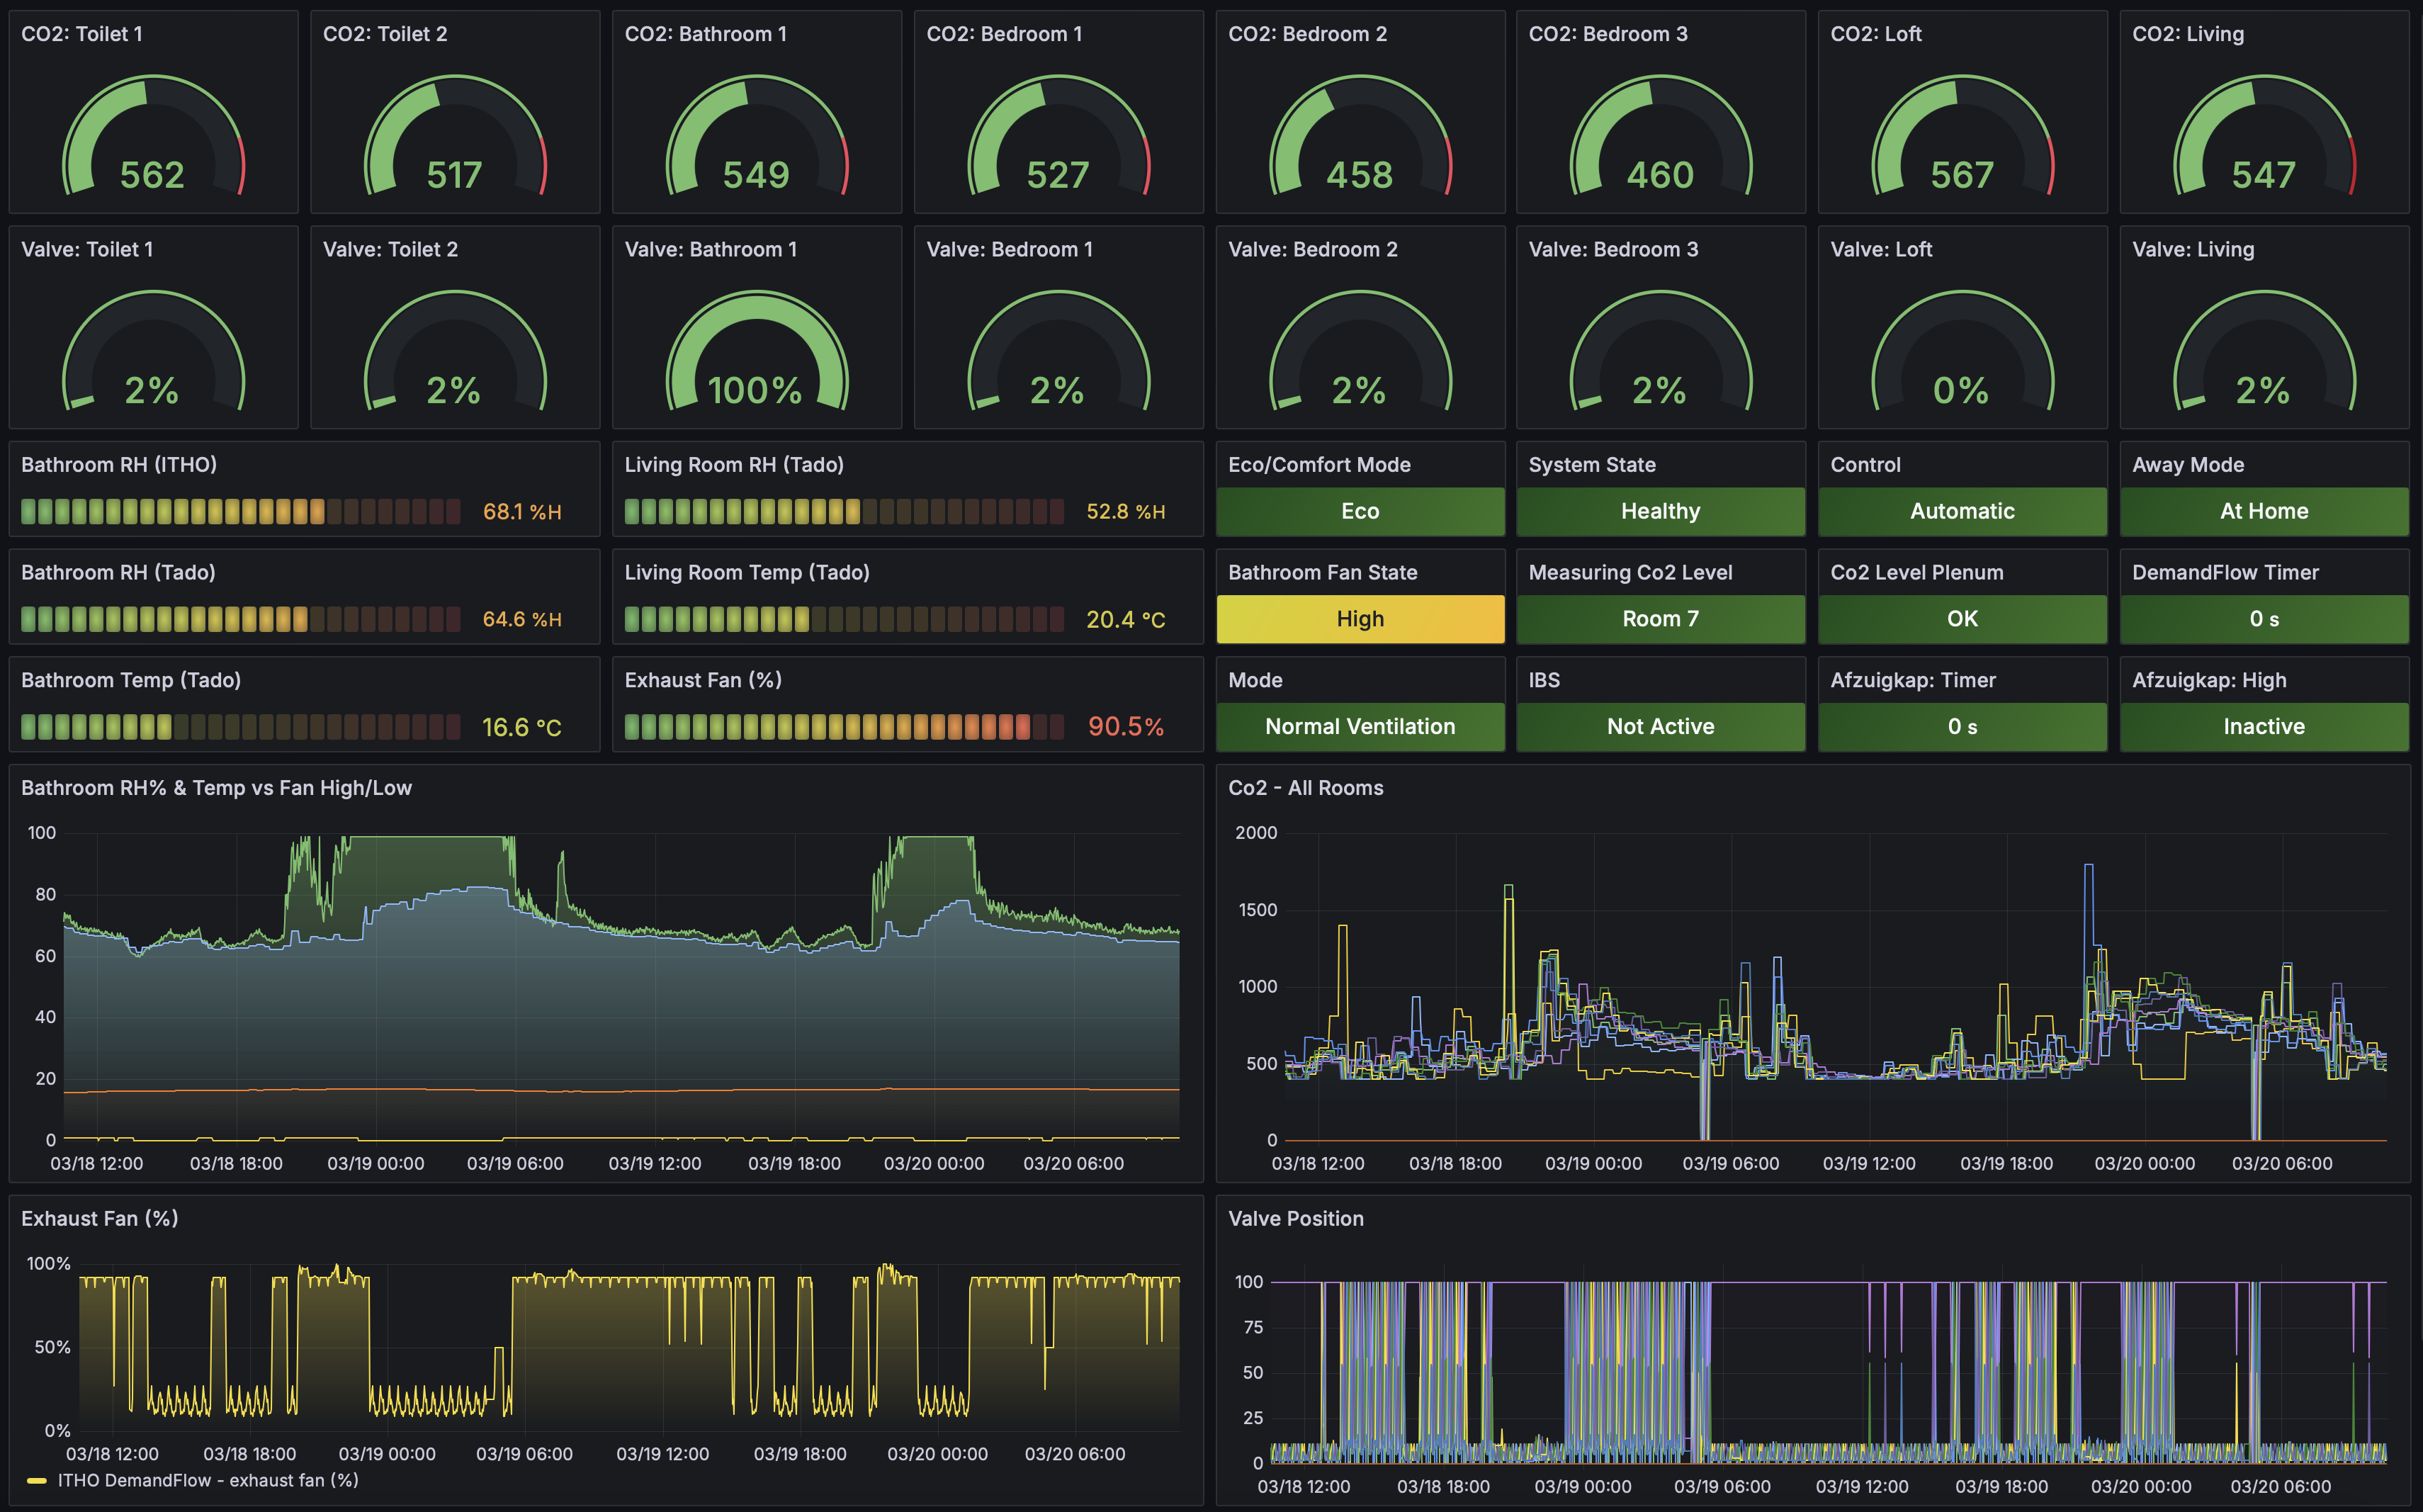
With the information available in the Zabbix database, it can be used to create a Grafana dashboard that is as functional as it is beautiful 🙂
Conclusion
This shows how modular these systems are, and how well you can integrate them. You can monitor literally anything, even the CO2 in your toilet. If you want to try this yourself, the Zabbix Template is available on my GitHub.